by Luke Rosiak
Multiple school districts across the country are considering busing-style programs to distribute impoverished students equally, but data suggest that such proposals would not reduce an achievement gap between poor students and their wealthier schoolmates, analyses by the Daily Caller News Foundation and others found.
Demographic-based redistricting seeks to spread poverty equally among all schools. In Fairfax County, Virginia, that would mean every middle school would have 35% of students in poverty. But a DCNF analysis found that the Fairfax school that currently most closely mirrors that rate has the worst test scores in the entire county for non-impoverished students, and nearly the worst scores for impoverished students.
Meanwhile, the middle school that currently has the absolute worst outcomes for impoverished students is the one that has a 50-50 split of impoverished and non-impoverished students, the review found. Students from poor families actually do better in schools where they are surrounded by students of similar backgrounds, rather than an even mix, the review found.
 The findings are a dramatic rebuke to rhetoric espoused by progressive school board members, who were met with protests in July over a plan to draw school boundaries to balance racial or socioeconomic characteristics, and who have hired a consultant to study drawing boundaries based on “equity.”
Elizabeth Schultz, one of two Republicans on the Democratic-dominated Fairfax school board, said that though wealthy students generally do better in school than impoverished students, the data don’t show that impoverished students get smarter simply by being around rich students. Rather, she said, it is school administrators who benefit from busing because it “covers up” problems at low-performing schools by replacing their students with already high-performing ones — raising the average without having to figure out how to help low-performing kids learn better.
“They make feel-good changes to attempt to close a gap when they’re not actually closing the gap. They’re just covering it up,” Schultz told the DCNF.
“I asked repeatedly, where is the data to show that moving boundaries will affect student achievement? They can’t do it,” she said. “They’re work off feelings. They’re deeply convicted ideologues who are inflicting it on unsuspecting families and taxpayers who aren’t paying attention.”
Howard County, Maryland
In Howard County, superintendent Michael Martirano and school board members spent October pushing a plan that could shuffle 7,300 students out of their current schools based on the bank accounts of their parents. The goal would be to have every school have close to the same number of poor students, measured as those receiving free and reduced meals (FARMs).
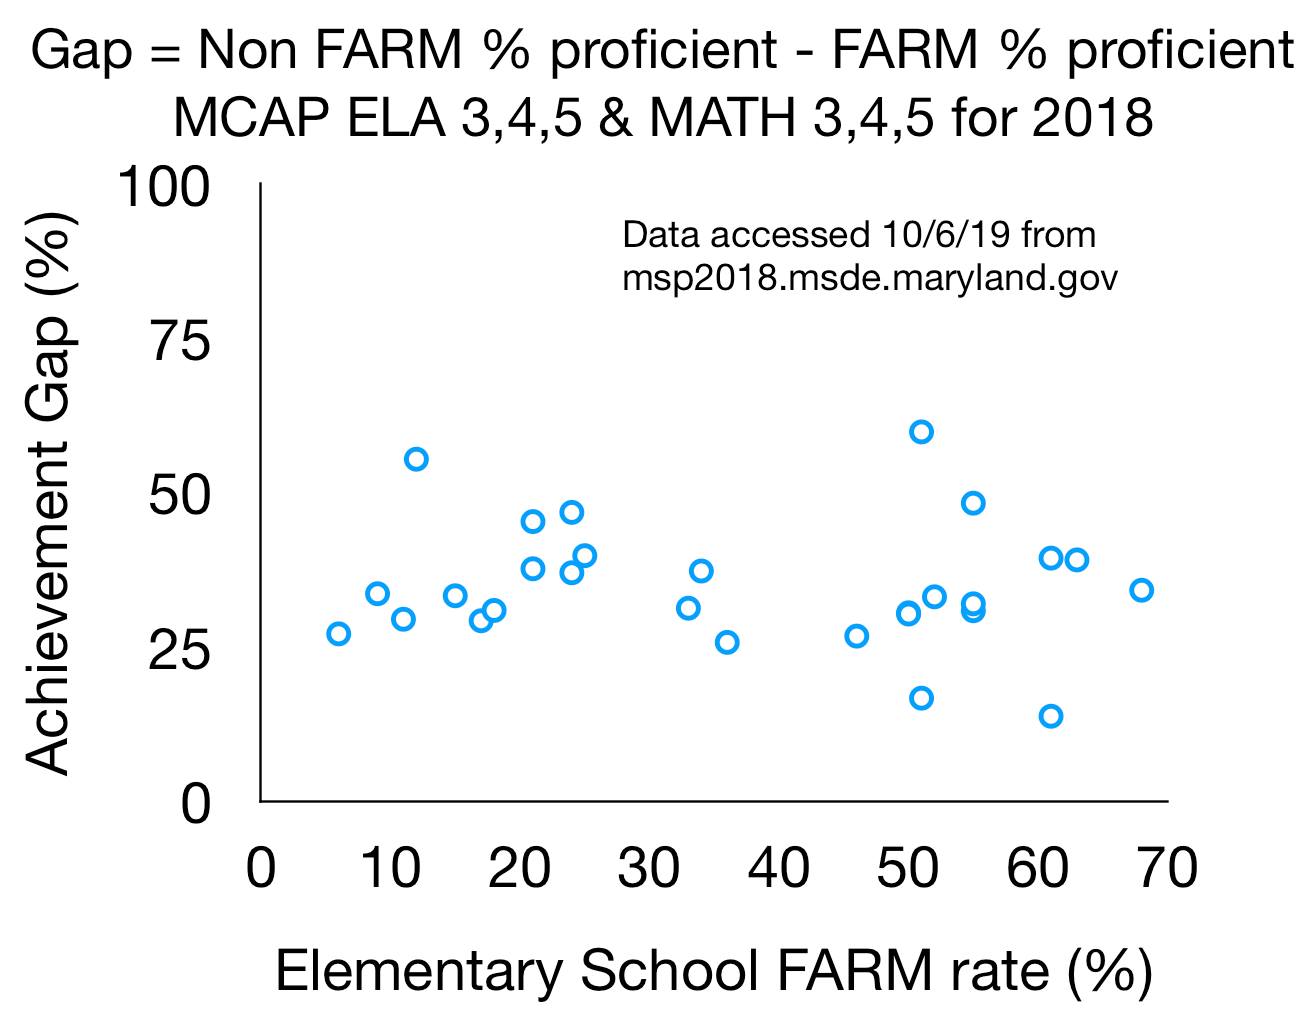
At a contentious hearing on Oct. 10, Sarah Bedair, a parent with a Ph.D. in engineering, presented the school board with data showing no correlation between the “achievement gap” and the number of students receiving for FARMs at Howard’s elementary schools. The achievement gap is a term, much-invoked by educators, for the lower performance of minority or poor children compared to others. Bedair calculated it as the difference in the percentage of elementary schoolers in each group who statewide exams found to be “proficient.”
“We are told the primary benefit is that students receiving FARM will experience improved educational outcomes, and this is justified with the weighted test score averages,” Bedair said. “But this is just massaging statistics and completely meaningless.”
“Your own county data shows no meaningful dependence whatsoever, and forced busing will never close the average county-wide 45% achievement gap,” she continued. “Claiming correlation between both of these data sets would never pass a peer review process.”
She said the board was “massaging statistics while ignoring underlying educational problems, using children as pawns in an ideological social experiment your own county data disproves.”
As seen on her chart below, where each blue dot represents one Howard elementary school, the achievement gap remained similar at schools that span the full range of demographic mixes. Schools with few poor kids are on the left, and schools with mostly poor kids are on the right.

In Howard County overall, 23% of students receive FARMs, so its “equity” goal would to make every school mirror that. Her analysis found that Howard schools that already have that ratio do not show a diminished achievement gap compared to less “equitable” schools — suggesting that if thousands of students were bused at considerable expense and disruption, the achievement gap would likely go unchanged. The smallest achievement gap, actually, is at the school with the third-highest poverty rate.
Resident Carl Manganillo spoke after Bedair: “Will the superintendent really tune out the well-respected individuals who have spoken? They’re some of the brightest minds in the region, and they’ve pointed out major flaws in the research. … Would you give your child medicine if the research was deemed to be inclusive?”
He said the board had heard 2,500 comments with opponents outnumbering supporters of the plan 100 to 1.
“As far as I can tell, the only proponents of this plan are the politicians,” Manganillo said. “This whole process is just a formality, they’re just going through the motions.”
“The calculus is already done,” he continued. “I don’t mean calculus like math — I don’t believe the super understands the math. But when it comes to political calculus, I’m sure he had full grasp and made sure he had the political cover to move forward.”
The board member most vocally opposing the plan was Chao Wu, a data scientist and Ph.D. and the board’s only immigrant member.
“I am writing to you in sheer shock and disapproval of your behavior towards Dr. Wu in last night’s work session on the massive redistricting of [Howard County Public School System],” resident Ashley Serio West wrote in an open letter to board chair Mavis Ellis following an Oct. 17 meeting. “I saw several eye rolls and many dismissive statements made towards him by yourself.”
“Dr. Wu was consistently rushed. I hope this is not because he is an immigrant or of Chinese descent,” Serio continued. “I do not believe it is prudent or wise to be dismissive of his views. His views represent the majority of my community.”
Howard’s school system has entire departments dedicated to data analysis, but if it had generated data showing no correlation between an achievement gap and the demographic makeup of schools, it did not produce it when presenting its plan.
A spokesman for Martirano, Brian Bassett, told the DCNF the superintendent has acknowledged that “simply reducing a school’s FARM percentage … will not automatically improve student outcomes.”
“The purpose of considering the socio-economic component was to increase equity,” Bassett said. “Children who live in poverty don’t have the same access to supports that fill their needs as children from families with means.”
He did not respond to followup questions asking what resources the school system provides to wealthy students but not poor students, whether the “access to supports” came from their home lives or the government, and whether there were any data from Howard’s schools showing that advantages from home life rubbed off on others through proximity.
Fairfax, Virginia
Schultz said school officials justify moving children with vague allusions to there being more “resources” at schools with fewer poor kids, even though schools with more impoverished children actually receive more money through a federal subsidy known as Title I funding.
In July, Fairfax County proposed a modification to its school boundary policy, striking factors such as “instructional effectiveness” and “the impact on neighborhoods” in favor of “the socioeconomic and/or racial composition of students” as the first priority when drawing school boundaries.
The redistricting, under a policy known as “One Fairfax,” would aim to make all schools in the 1.2-million-person, 400-square-mile county have students with poverty characteristics similar to the county as a whole.
The school board and superintendent “are developing a comprehensive boundary plan, to serve the goal of diversity above all,” school board member Pat Hynes tweeted on March 31.
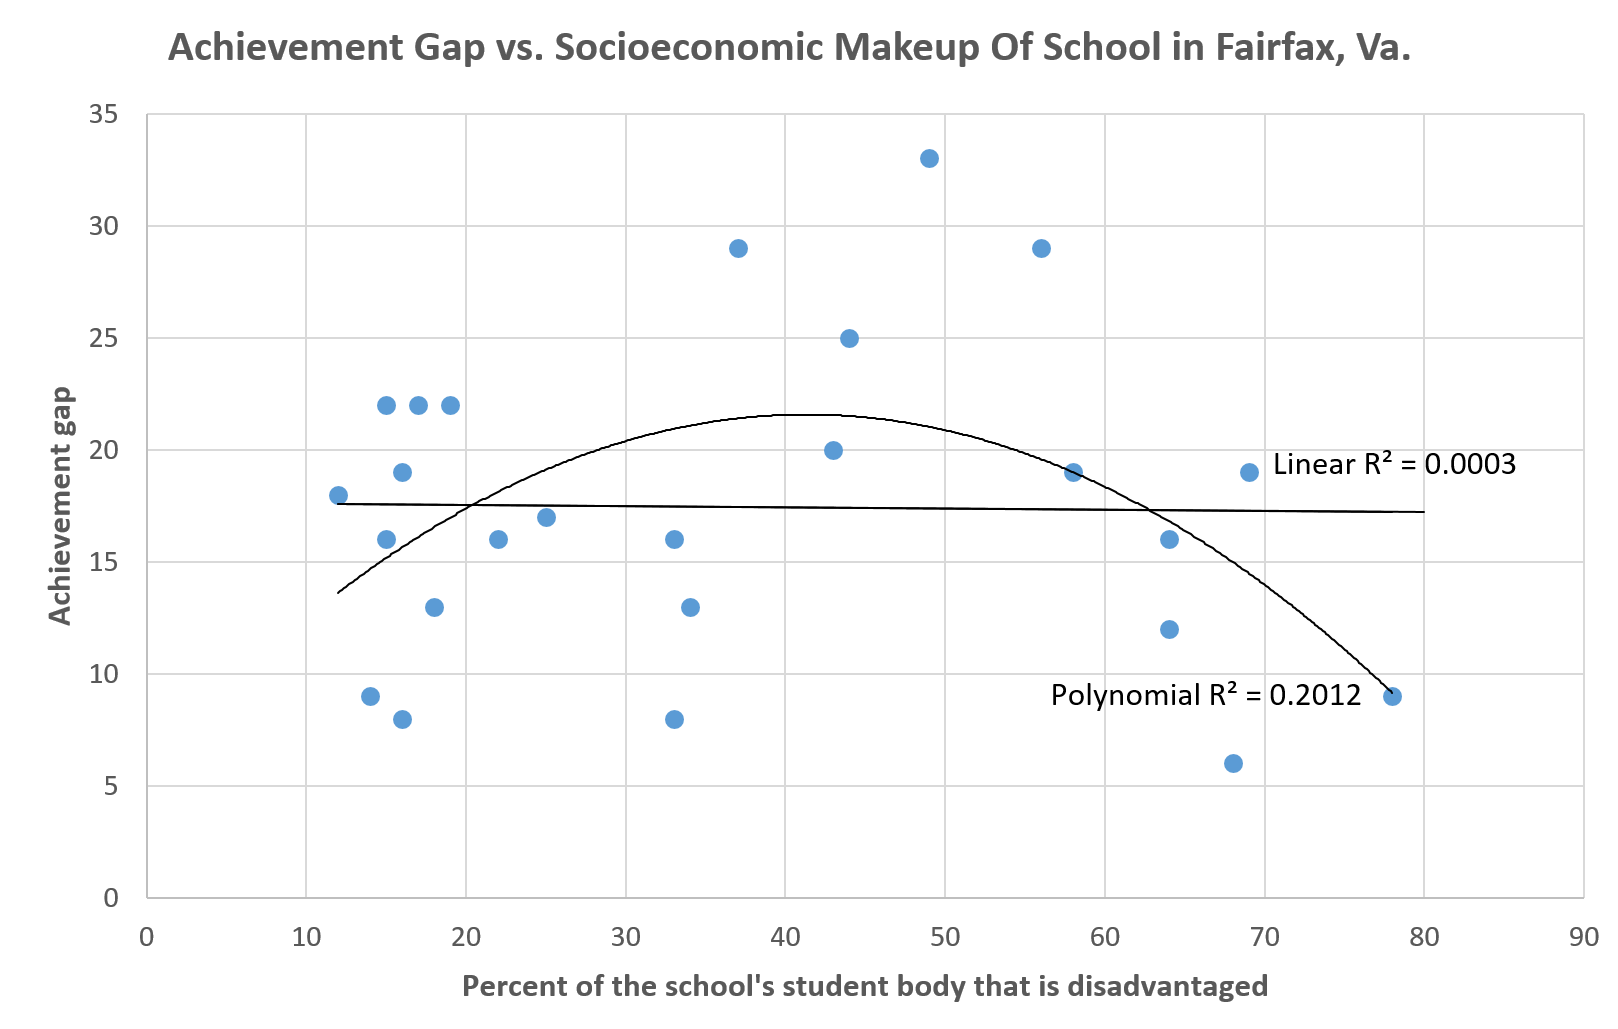
A DCNF data analysis of Fairfax’s existing middle schools using Virginia standardized test passage rates found the same result as in Howard: that there is no connection between the overall demographics of a school and the performance gap between individual poor and non-poor students in those schools.
In the graph below, each blue dot represents one middle school, with schools with mostly non-impoverished students on the left, and schools with high poverty rates on the right. The higher up a blue dot is, the worse the disparity is between poor and non-poor kids at the school. The straight line is the “line of best fit,” and the fact that it is completely flat shows that there is no connection whatsoever.

A curved line, which can capture more nuanced trends, highlights that the achievement gap is worst in schools that are heavily socioeconomically integrated.
The DCNF calculated each middle school’s achievement gap as the difference between the percentage of so-called disadvantaged students who passed Virginia’s statewide “Standards of Learning (SOL)” exams in eighth grade math in the 2018-2019 school year, versus the percentage of non-disadvantaged students who passed. Virginia’s exams data define disadvantaged students as those eligible for poverty assistance.
Presented with the data, a Fairfax schools spokeswoman, Kathleen Thomas, said, “Your graph depicts the relationship between overall demographics of a school and the achievement gap. FCPS finds that the level of enrollment of economically challenged students is related to the overall level of performance for all students attending that school with decreasing performance for all students as levels increase.”
The DCNF asked whether she was simply making the well-known observation that schools with many wealthy students have higher overall test scores (because of the scores of those wealthy students themselves) or whether Fairfax had data showing that economically disadvantaged students themselves score higher when they attend schools with an equitable distribution of socioeconomics. Thomas did not respond.
The DCNF then looked at hard numbers — the average test scores of the two economic groups, based on the statewide eighth grade math exams scored on a scale of 0 to 600 — and found little support for the former theory.
In the below chart, each school is represented by two dots, with the blue dot on top showing the average test score of non-disadvantaged students and the orange dot directly below it representing the average test score for disadvantaged students at that school.

The DCNF’s analysis of Virginia Department of Education data, looking at Fairfax’s existing middle schools, found that without exception, impoverished students scored higher in schools where they were surrounded by those of similar backgrounds compared to an even mix.
The analysis indicated that the effect of highly socioeconomically integrated schools brought down non-impoverished students more than it helped impoverished students.
“There’s too many of you who are performing, so we’re going to move you?” Schultz said. “When does it become the responsibility of a child to be the one whose job is to be in a classroom to bring others up?”
At Sandburg Middle School, 49% of the test-takers were economically disadvantaged. The wealthier half had an average test score of 454, while the disadvantaged half averaged 399. At every school where a majority of test-takers were impoverished, poor kids performed better than they did at Sanburg, while in five out of seven cases, wealthier kids did worse.
Overall, 35% of Fairfax County test-takers were disadvantaged, according to the Virginia Department of Education data, so in the perfect “equity” situation, every Fairfax school would look similar to Hayfield Secondary School, which is 34% disadvantaged.
Incidentally, the data show that Hayfield is by far the worst school in the entire county for non-impoverished students, with an average test score of 429. The countywide average for non-impoverished students is 466.
Impoverished children at the perfectly “equitable” Hayfield also fared worse than they did in schools with more fellow impoverished students. Hayfield’s average test score for impoverished students is 409, lower than the current countywide disadvantaged average of 419. Impoverished Hayfield students did worse than they did at Poe, whose test-takers were 78% poor; Glasgow, whose test-takers were 69% poor; and Key, whose test-takers were 68% poor.
Asked to interpret those results, Schultz said that when school boundaries are drawn simply based on geography, in some cases it may allow for the more effective deployment of specialized resources, allowing educators to tailor strategies to particular needs. For example, English-as-a-second-language teachers can be deployed to locations where a particular foreign language is commonly spoken, and social workers with experience in trauma can develop expertise in working with high-needs students.
Around the country
In liberal alcoves, activist-fueled orthodoxy on racial education policies has failed to lead to measurable improvement.
West Coast cities are the epicenter of the equity movement, with Seattle on the forefront.
“In 2013, Seattle’s school board introduced ‘racial equity teams’ as part of a five-year plan to tackle a chronic achievement gap,” The Washington Post reported in August. “The plan expired without making a significant impact, critics say. Recent research from Stanford University found that from 2016 to 2017, the gap in test scores between black and white students in Seattle actually increased.”
Shaker Heights, Ohio, has for decades acted as deliberately for racial integration and achievement as anywhere could hope to, the Post reported in October. But in a community that is roughly half white and half black and implements busing, 68% of white students were in advanced classes, compared to only 12% of black students.
Schultz said school boards routinely fail to conduct rigorous data analysis about whether favored policies actually work.
“I think fundamentally the people that wind up in education leadership are not learned in data and data analytics, and you certainly don’t have them on the school board,” Schultz continued. “The policy leaders know nothing about information analytics and are not asking for it and are not getting it.”
“Everyone’s making decisions based on how they feel, uninformed by an authentic data,” she said. “They’ll throw up a Powerpoint slide and everyone will clap and go on their merry way. There’s no rigorous examination of any of it, and the students haven’t learned. They’re just doing what feels good.”
– – –
Luke Rosiak is a reporter at Daily Caller News Foundation.


